
Fire Weather Index map
Fire Weather Index map concept
Using simple URL you can get the following Fire Weather Index maps:
-
Current Fire Weather index maps
-
Forecast Fire Weather index maps: The forecast for 5 days with a daily step
To recieve infromation about current and forecast fire weather index data in JSON format please read here.
Fire Weather Index map is designed to help users to estimate current and forecast fire danger. Predictions of fire danger conditions based on the Canadian Forest Service Fire Weather Index Rating System (FWI).
Fire Weather Index (FWI) is a numerical rating of the potential frontal fire intensity and indicates fire intensity by combining the rate of fire spread with the amount of fuel being consumed.
Fire Weather Index range values
FWI is classified in 6 classes of danger (very low, low, medium, high, very high and extreme). The fire danger classes are the same for all countries and maps show a harmonized picture of the spatial distribution of fire danger level. The following are the FWI values used as thresholds of the fire danger classes:
| Fire danger class number | Fire danger class name | FWI ranges (upper bound excluded) |
|---|---|---|
| 0 | Very low | <5.2 |
| 1 | Low | 5.2-11.2 |
| 2 | Moderate | 11.2-21.3 |
| 3 | High | 21.3-38.0 |
| 4 | Very high | 38.0-50.0 |
| 5 | Extreme | ≥50 |
URL format and parameters
Use the following URL format and parameters to get Fire weather Index maps. Please pay attention to the URL example.
API call
https://maps.openweathermap.org/maps/2.0/fwi/{z}/{x}/{y}?appid={API key}&date={date}
| Parameters | ||
|---|---|---|
{z} |
required | Number of zoom level. You could find information about correlation between zoom levels, X, Y tile coordinate numbers and level scale here |
{x} |
required | Number of x tile coordinate. You could find information about correlation between zoom levels, X, Y tile coordinate numbers and level scale here |
{y} |
required | Number of y tile coordinate. You could find information about correlation between zoom levels, X, Y tile coordinate numbers and level scale here |
appid |
required | Your unique API key (you can always find it on your account page under the "API key" tab) |
date |
optional | Date and time of (Unix time, UTC), e.g. date=1527811200. If you do not specify any date and time, you will get Current Fire Weather Index map. More information about how to get Current, and Forecast fire weather index maps you can find here. |
URL example
https://maps.openweathermap.org/maps/2.0/fwi/4/1/6?appid={API key}&date=1600780200
You need to insert the generated URL into special plugins.
For example, Leaflet, OpenLayers. You can also use any other apps that support the display of layers. Learn more.
How to get Current and Forecast Fire Weather Index maps using only 'date' parameter?
To get Current and Forecast Fire Weather Index maps you just need to change only
date parameter in the URL request:
1. Current Fire Weather Index maps. Specify the current date and time to get Current Fire Weather Index map. The date and time specified in the request will be rounded to the midday local time of the current day. If you do not specify any date and time, you will get Current Fire Weather Index map.
2. Forecast Fire Weather Index maps. You can specify any date and time within the next 5 days to get the Forecast Fire Weather Index maps for the specified time. The date and time specified in the request will be rounded to the midday local time of the forecasted day. If you do not specify any date and time, you will get Current Fire Weather Index map.
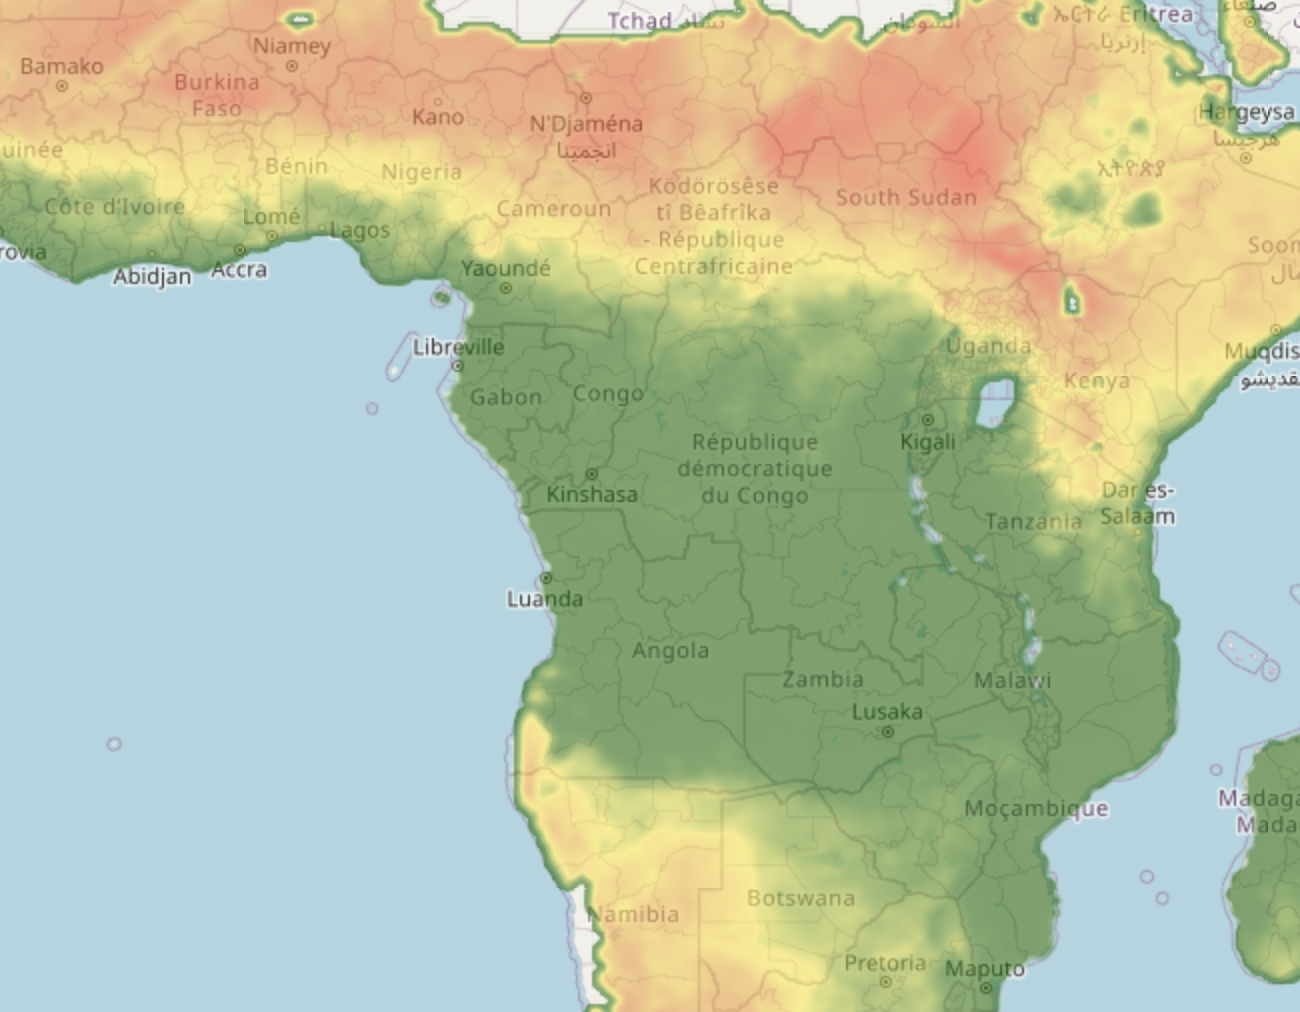
Example of Fire Index maps
Please pay attention that for geographical coordinates with zero probobility of Fire Weather
Index filling is absent.
Fire Weather Index map
Fire Weather Index map default palette
By default in Fire Weather Index maps used the palette below:
0:126E00;35:FFEB3B;75:ED8E3E;150:FF0000;200:890000;300:FF00FB
Libraries to connect weather layers
Open Layers
The following functions are available for the OpenLayers library:
- Classes of weather layer and weather stations layer
- Possibility to set your own style
- Classes with clustered markers
- Support of marker server clustering
Leaflet
The OpenWeatherMap javascript library is designed to work with the Leaflet mapping service. The current version of the library allows the following:
- Embedding of layer with current weather in cities
- Embedding of layer with weather stations
- The library supports customer clustering
Leaflet library
Another implementation of map based on Leaflet technology supports OWM's TileLayers and
current city/station data. It is configurable with many options. For current city/station
data the library supports refreshing the data in intervals, some types of client-side
clustering (show only the station/city with the highest rank for a defined pixel square),
custom image set (if you provide one), different languages (en,
de, ru, fr, but translation is incomplete),
minZoom and others.
Source and documentation (README.md) is available on GitHub https://github.com/buche/leaflet-openweathermap
Example of weather map: https://github.com/owm-inc/VANE-intro/tree/master/apps